|
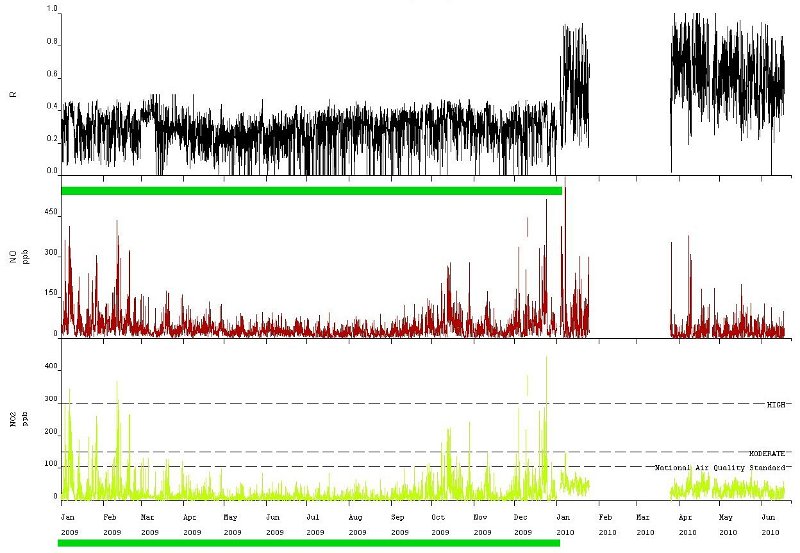 |
The top chart shows the NO2 / NOx ratio. Clearly something happened on 1 January 2010. The 2009 NO looks remarkably similar to the NO2. Perhaps they are both NO but scaled differently! |
|
| Total images: 50 | Help | |
|
|
|
The top chart shows the NO2 / NOx ratio. Clearly something happened on 1 January 2010. The 2009 NO looks remarkably similar to the NO2. Perhaps they are both NO but scaled differently! |
|
| Total images: 50 | Help | |